Welcome to applefy#
This is the documentation of applefy, a Python package for calculating
detection limits for exoplanet high contrast imaging (HCI) datasets. In this
documentation, we explain the how to use the package and provide some guides to
help you get started. We also provide the code to
reproduce the plots in Bonse et al. 2023.
We did our best to follow best practices for software development and document all important steps. However, the code is still experimental. If you encounter any difficulties, don’t hesitate to contact us for assistance.
Please read the section about Citation if you use applefy.
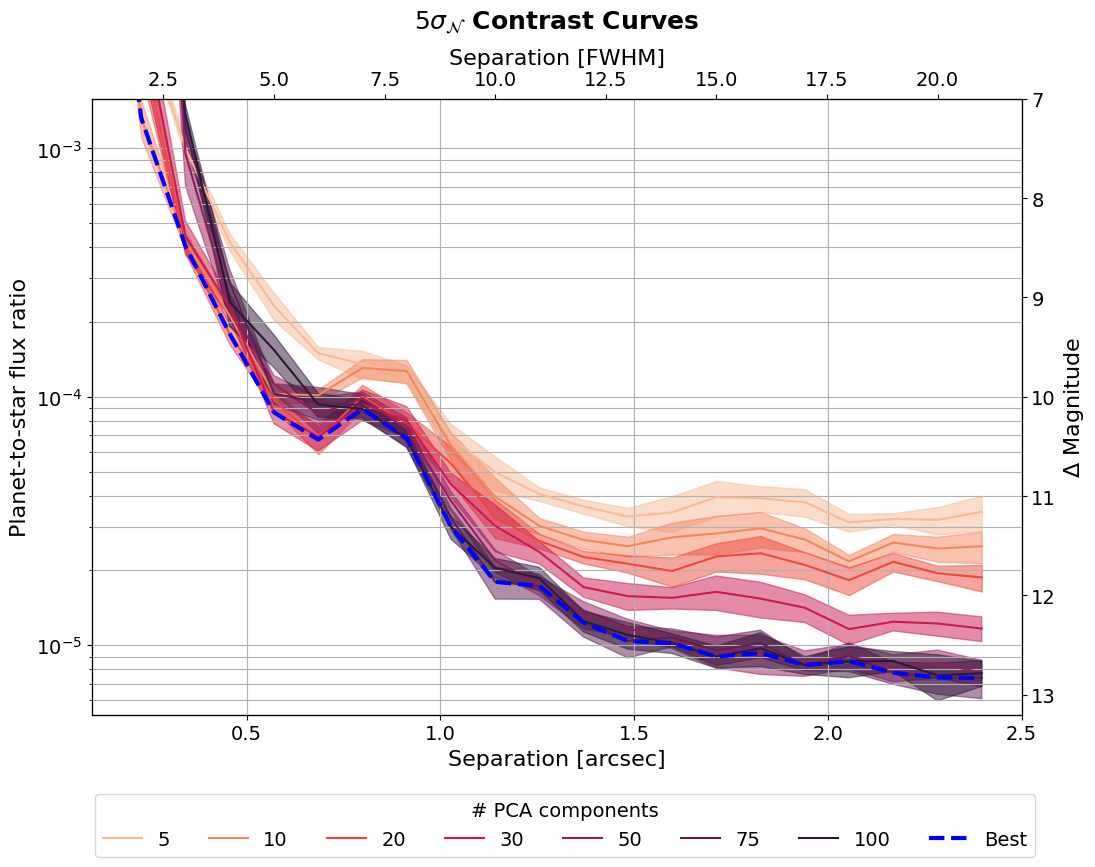
Contrast Curves#
Applefy provides a number of features and functionalities to improve the accuracy and robustness of contrast curve calculations. Here is an example of some contrast curves calculated with applefy using the t-test discussed in Mawet et al. 2014.
Non-Gaussian noise#
One of the key strengths of applefy is its ability to
handle non-Gaussian residual noise
through parametric bootstrapping. Residuals from ground-based
HCI observations are often limited by speckle noise. Even after using advanced
post-processing algorithms, this speckle noise often deviates from Gaussian noise.
Especially close to the star, the noise is often better described by Laplacian
than by Gaussian noise. With applefy you can easily change the assumed
noise distribution.
Contrast Grids#
Another key feature of the package is the option to compute contrast grids: A new way to explore which planets are detectable given their planet-star flux ratio and separation from the star. Here is an example of an interactive contrast grid.
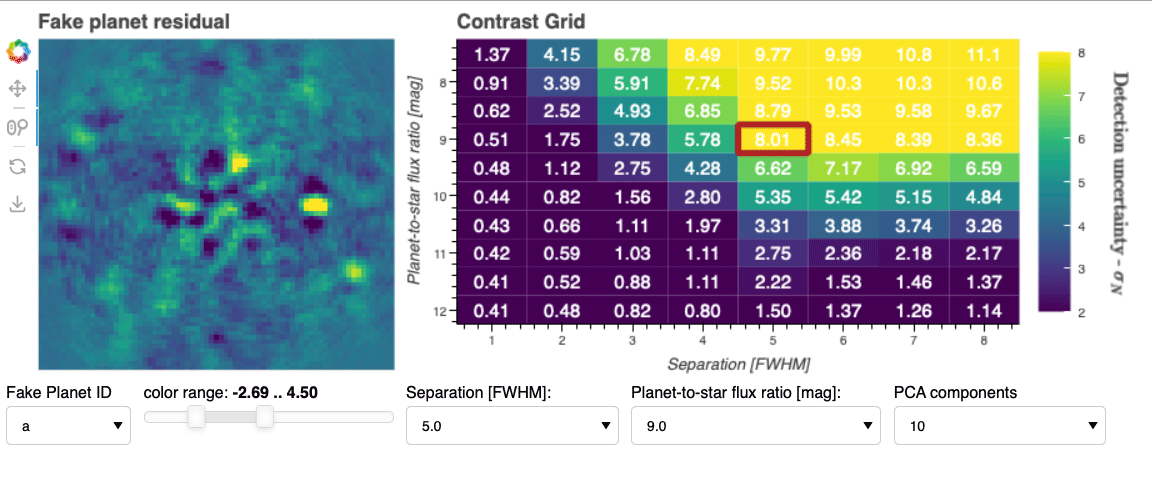
Click on the GIF animation to load the interactive version of the plot (~70 MB)